Pro mode
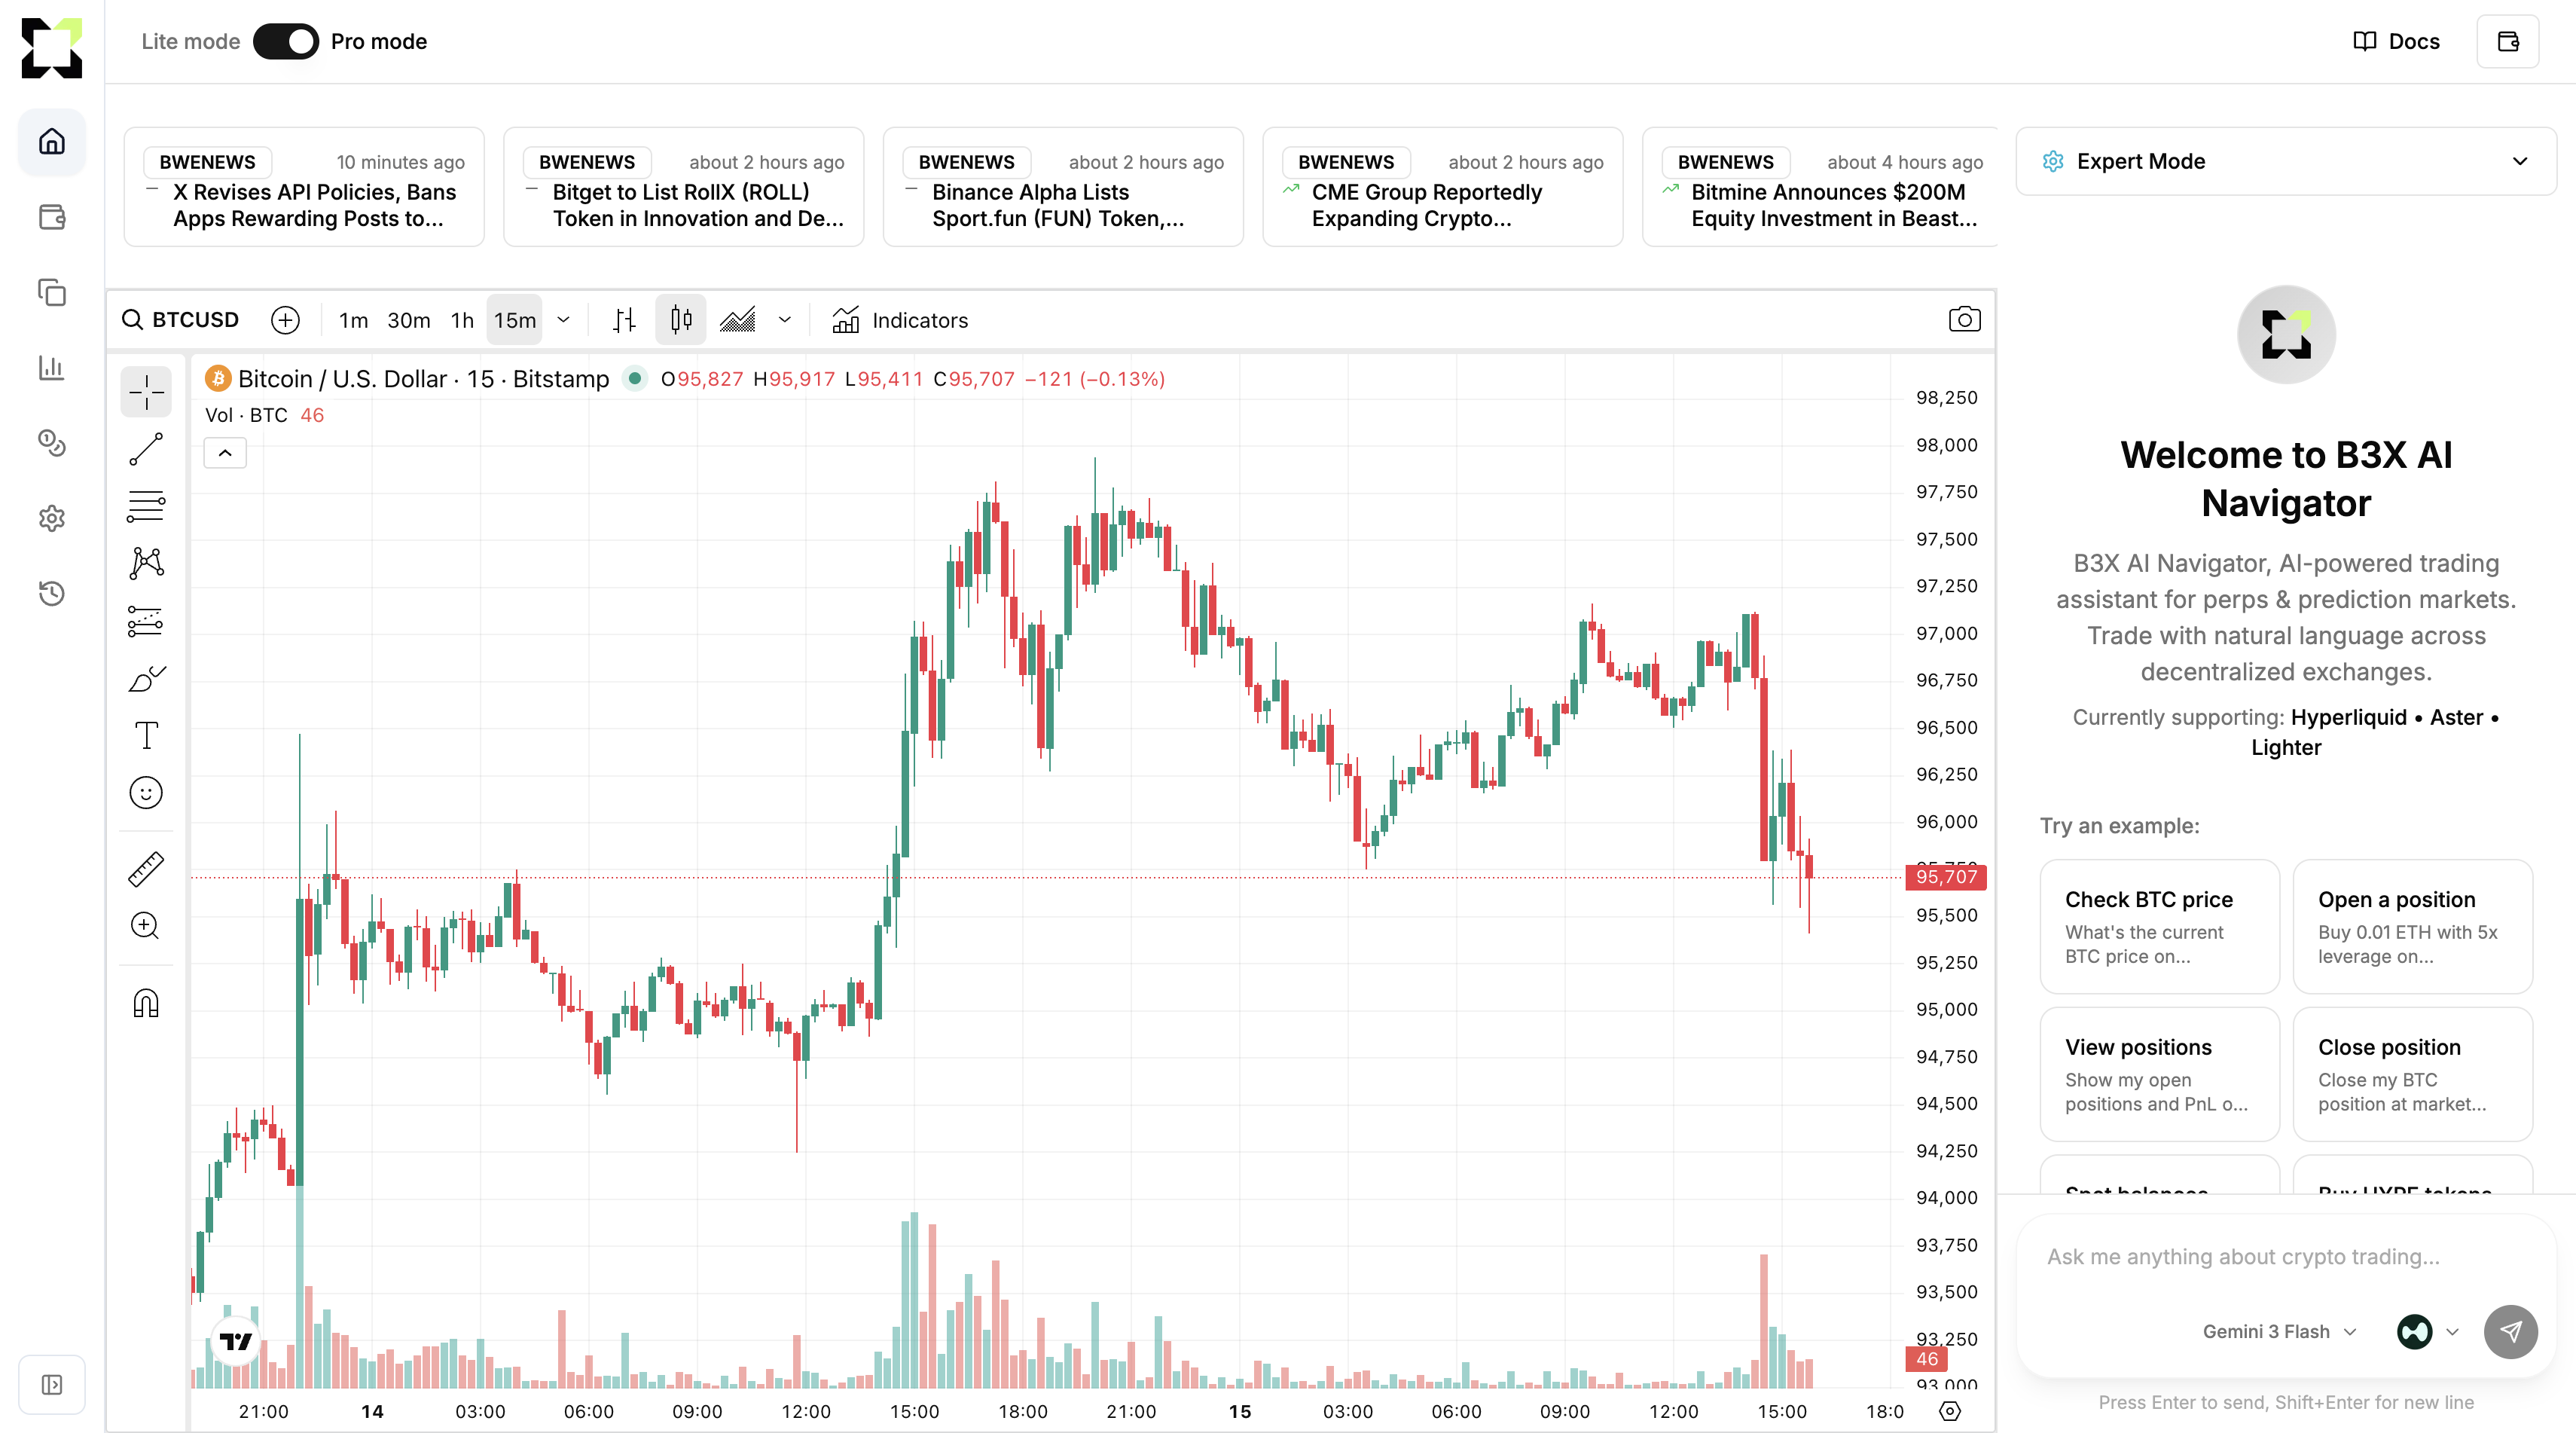
Pro mode turns B3X AI Navigator into a professional trading workstation. You get real-time market news, advanced charting with technical indicators, and AI chat trading all in one interface. Built for traders who need full market analysis alongside AI execution.
Overview
Pro mode gives you a multi-panel layout with everything for informed trading:
- Market news feed - Real-time crypto news with AI market analysis
- Trading chart - TradingView integration with customizable indicators
- Expert mode - Pre-configured strategies and indicator selection
- AI chat - Natural language trading commands with full context
Pro mode only works on desktop devices (screen width ≥ 768px). The interface automatically switches to Lite mode on mobile for a better experience.
Enabling pro mode
Toggle pro mode
- Go to the Chat page
- Find the Pro mode toggle in the top-right corner
- Click to switch between Lite mode and Pro mode
Your preference saves automatically and persists across sessions.
When you first enable pro mode, the interface reorganizes into a 4-panel layout. Give it a moment to load the TradingView chart and news feed.
Interface layout
Pro mode uses a grid with four main sections:
1. Market news (top-left)
Horizontal scrolling feed of the latest crypto news with AI market analysis.
Features:
- Real-time updates (refreshes every 60 seconds)
- AI-analyzed sentiment (bullish/bearish/neutral)
- Confidence scores
- Source attribution (BWENEWS, etc.)
- Timestamps
How to use:
- Scroll horizontally through news cards
- Click any card to view full details
- Selected news appears in the panel below the chart
News card info:
- Source badge - News provider
- Timestamp - When published
- Direction icon - Market sentiment (bullish, bearish, neutral)
- Headline - News title
2. Trading chart (center-left)
Full TradingView chart with real-time price data and technical indicators.
Default settings:
- Symbol: BTC/USD
- Interval: 15 minutes
- Theme: Matches your app theme (dark/light)
- Chart type: Candlestick
Features:
- Full TradingView functionality
- Symbol search and switching
- Multiple timeframes (1m, 5m, 15m, 1h, 4h, 1d, etc.)
- Drawing tools and annotations
- Volume indicators
- Customizable indicators via expert mode
How to use:
- Use symbol search to change trading pairs
- Select timeframes from the interval selector
- Apply indicators through expert mode
- Use drawing tools for analysis
3. News details (bottom-left)
When you select a news item, detailed analysis appears below the chart.
What you see:
- Summary - Full article summary
- Market analysis - AI impact assessment
- Direction (bullish/bearish/neutral)
- Confidence level (0-100%)
- Affected coins/tokens
- Short-term impact - Expected immediate effects
- Long-term impact - Projected consequences
- Affected assets - Cryptocurrencies likely impacted
How to use:
- Click any news card in the feed
- Review the analysis
- Use insights to inform your trades
- Click X to close and return to full chart
4. AI chat (right side)
Full AI chat interface with expert mode controls at the top.
Components:
- Expert mode dropdown - Strategy and indicator selection
- Chat messages - Conversation history
- Chat input - Natural language commands
- DEX selector - Choose trading exchange
- Model selector - Select AI model
All standard chat features work in pro mode. See AI chat trading basics for full chat functionality.
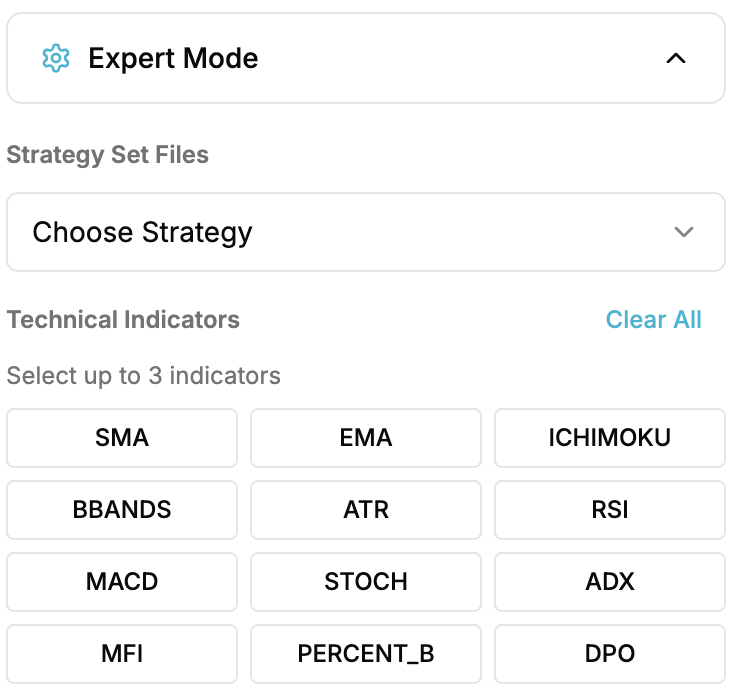
Expert mode
Expert mode lets you apply pre-configured trading strategies or manually select technical indicators for your chart.
Accessing expert mode
- Find the Expert mode panel at the top of the chat interface
- Click to expand the dropdown
- Choose a strategy or select individual indicators
Strategy sets
Pre-configured trading strategies with optimized indicator combinations.
Available Strategies:
| Strategy | Indicators | Best For |
|---|---|---|
| Triple Confluence | EMA, BBANDS, RSI | Multi-timeframe confirmation |
| Scalping EMA | EMA, RSI, MACD | Short-term momentum trades |
| Scalping RSI | BBANDS, ATR, RSI | Oversold/overbought scalping |
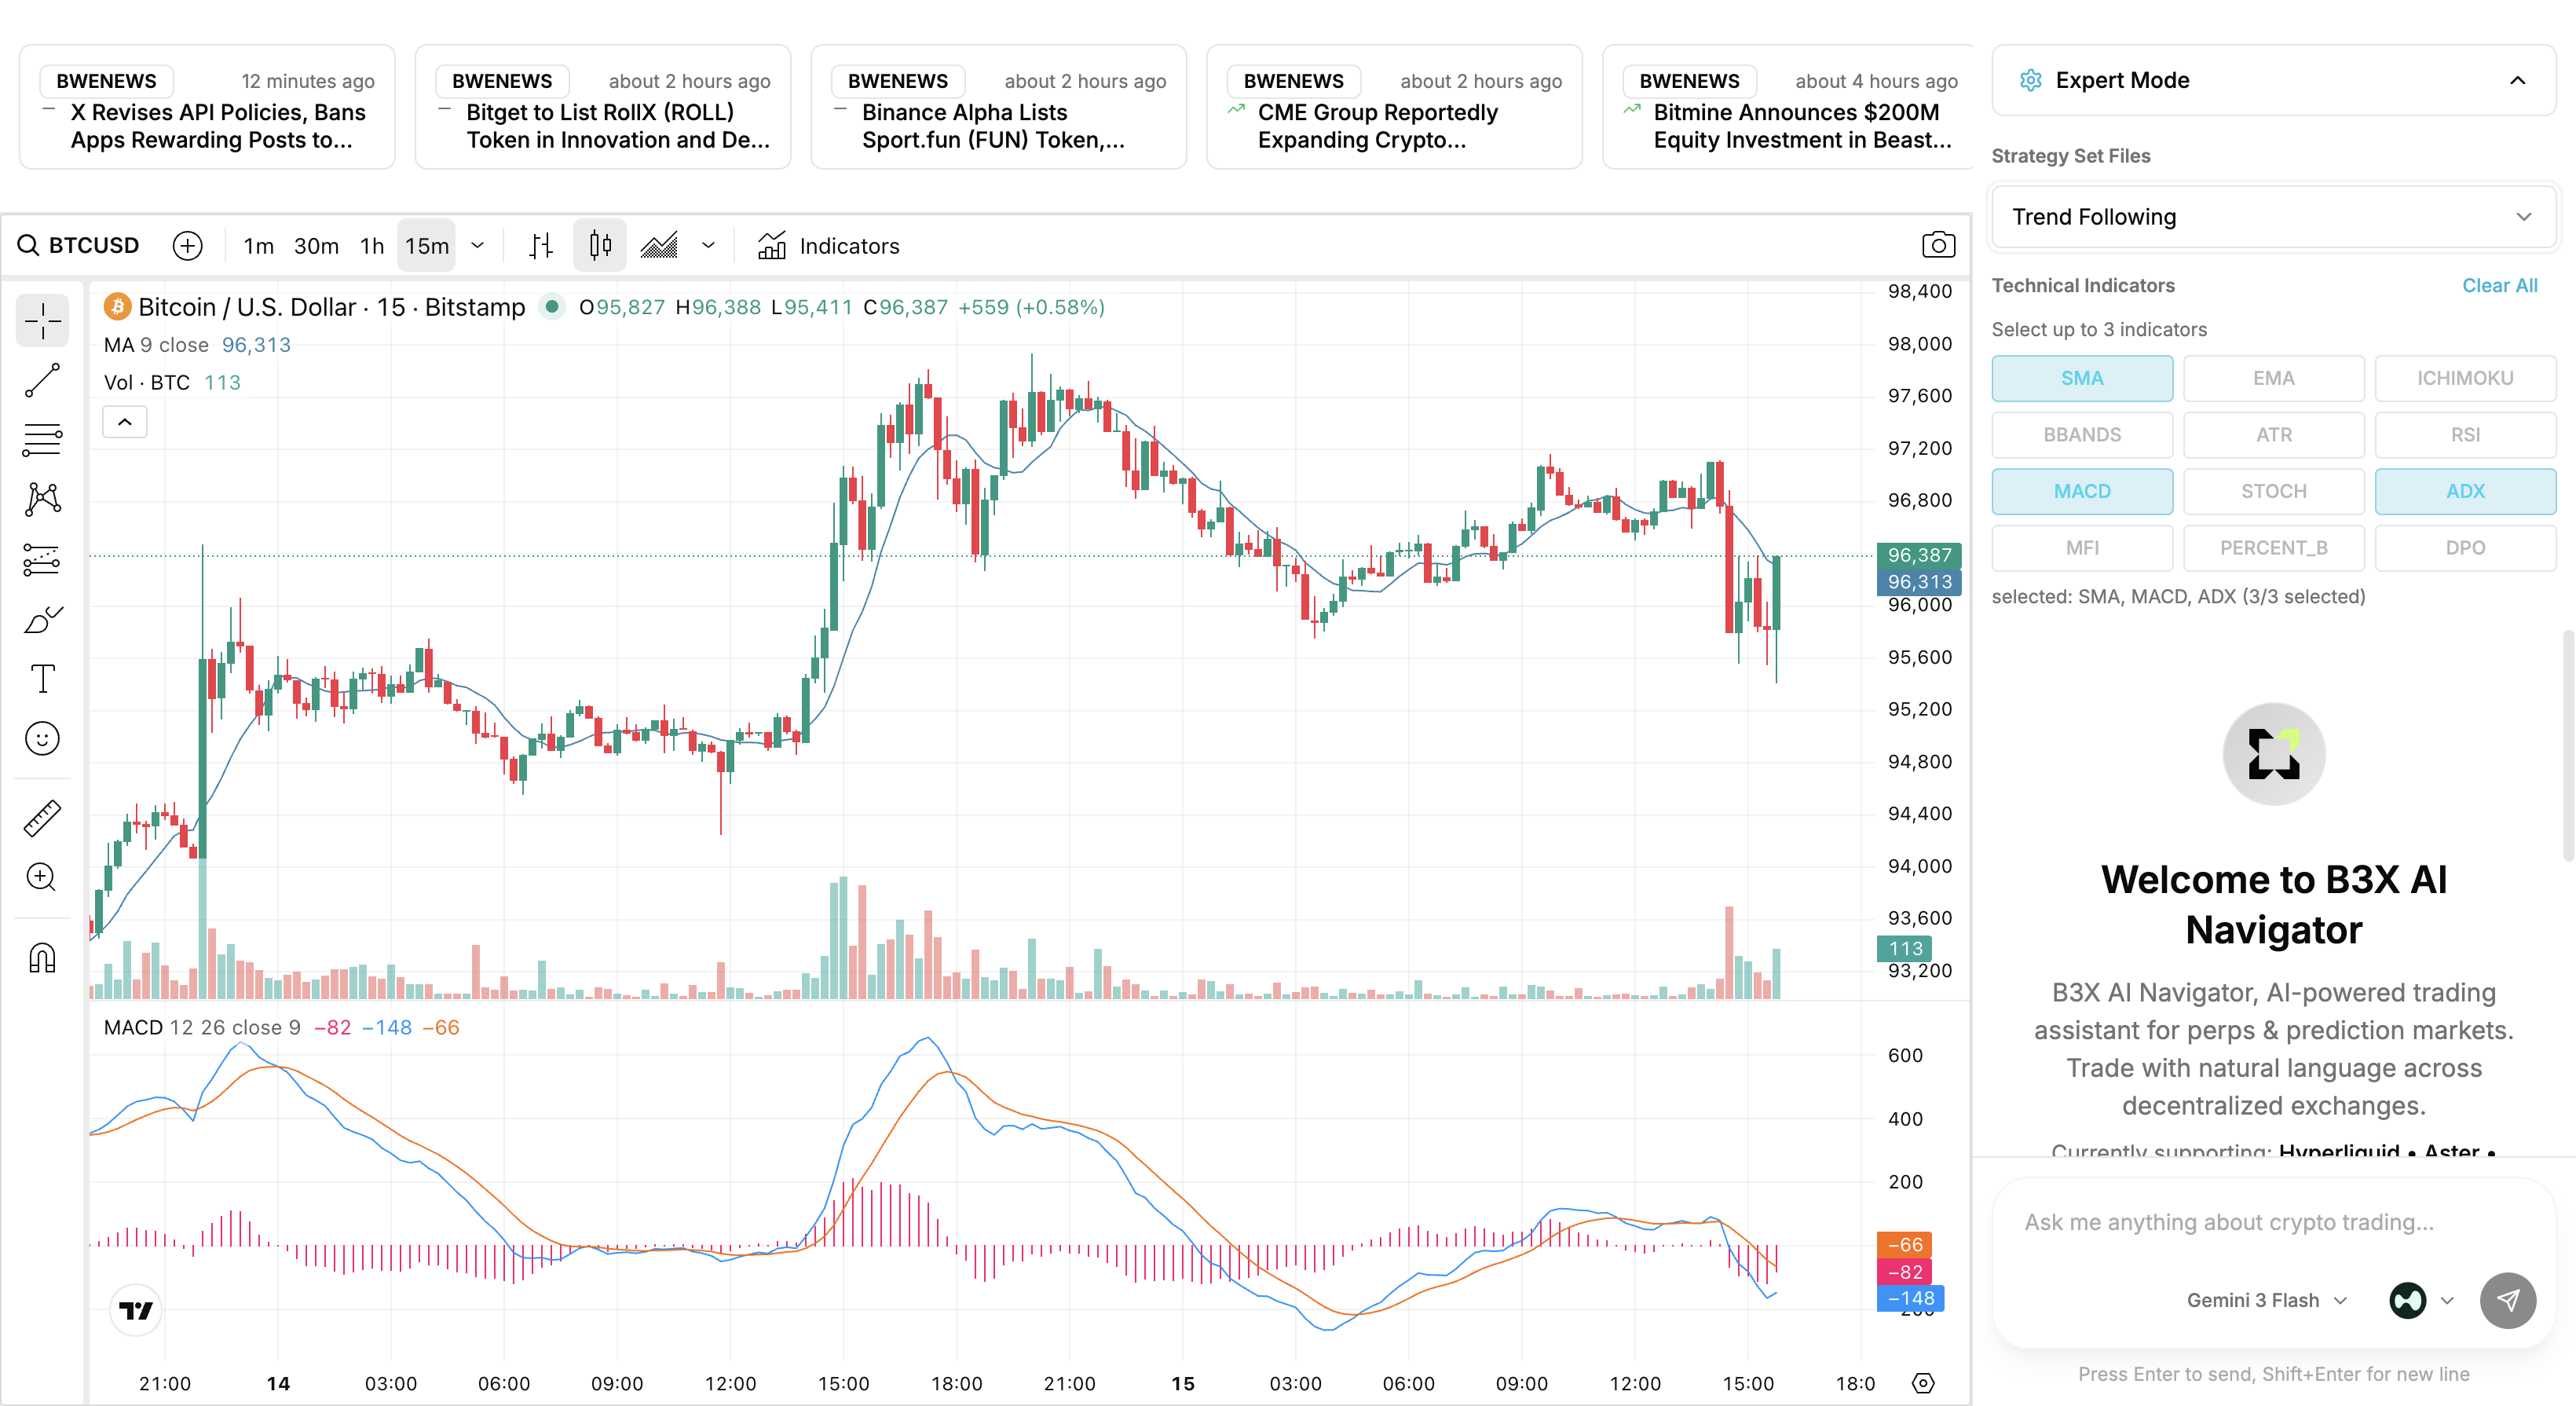
| Trend Following | SMA, MACD, ADX | Riding strong trends |
| Momentum Swing | RSI, MACD, ADX | Swing trading momentum |
| Mean Reversion | BBANDS, RSI, STOCH | Range-bound markets |
| Volatility Breakout | BBANDS, ATR, ADX | Breakout trading |
How to use:
- Click the Choose strategy dropdown
- Select a strategy from the list
- Chart automatically applies all indicators
- To deselect, click the same strategy again or Clear all
When a strategy's active, you can't manually select indicators. Clear the strategy first to customize.
Technical indicators
Select up to 3 indicators to display on your chart.
Available Indicators:
- SMA - Simple Moving Average
- EMA - Exponential Moving Average
- ICHIMOKU - Ichimoku Cloud
- BBANDS - Bollinger Bands
- ATR - Average True Range
- RSI - Relative Strength Index
- MACD - Moving Average Convergence Divergence
- STOCH - Stochastic Oscillator
- ADX - Average Directional Index
- MFI - Money Flow Index
- PERCENT_B - Percent B (Bollinger Bands)
- DPO - Detrended Price Oscillator
How to use:
- Click up to 3 indicator buttons
- Selected indicators highlight in cyan
- Chart updates automatically
- Click Clear all to remove all indicators
- Click a selected indicator again to deselect
Indicator limit:
You can only have 3 indicators active at once. This prevents chart clutter and keeps things readable. When you've selected 3, the rest become disabled.
Selected indicators and count show at the bottom of the expert mode panel:
selected: SMA, MACD, ADX (3/3 selected)
Workflows
News-driven trading
- Monitor feed - Watch for breaking news
- Analyze impact - Click news to read AI analysis
- Check chart - Review price action
- Apply indicators - Use expert mode to add relevant indicators
- Execute - Use AI chat to place orders
Example:
[News: "Bitcoin ETF Approval Announced"]
→ Click news card to read analysis
→ Check BTC chart for price reaction
→ Apply "Momentum Swing" strategy
→ Chat: "Long 0.1 BTC with 5x leverage"
Technical analysis trading
- Select strategy - Choose a pre-configured strategy
- Analyze chart - Look for entry signals
- Confirm with news - Check if recent news supports your analysis
- Place trade - Use AI chat to execute with risk management
- Monitor position - Track performance in chat
Example:
[Select "Triple Confluence" strategy]
→ EMA, BBANDS, RSI appear on chart
→ Identify bullish confluence
→ Check news for negative catalysts
→ Chat: "Long 0.2 ETH with 3x leverage, set SL at $2,300"
Multi-asset monitoring
- Browse news - Scan feed for opportunities
- Switch symbols - Use symbol search to compare charts
- Compare indicators - Apply same strategy to different assets
- Prioritize - Identify strongest setups
- Execute - Trade the best opportunity
Example:
[News mentions BTC, ETH, and SOL]
→ Check BTC chart with indicators
→ Switch to ETH, apply same indicators
→ Switch to SOL, apply same indicators
→ ETH shows strongest setup
→ Chat: "Long 1 ETH with 5x leverage"
Tips
Start with news
Check the news feed before trading. AI-analyzed news can reveal catalysts that aren't visible on the chart alone.
Use strategies for consistency
Pre-configured strategies give you proven indicator combinations. Stick to one strategy per session.
Don't overload indicators
The 3-indicator limit exists for a reason. More indicators don't mean better signals. Focus on confluence between your selections.
Combine analysis with AI
Use chart and news for analysis, then use AI chat for execution. The AI can calculate position sizes, set stop-losses, and manage risk.
Monitor news updates
News feed refreshes every 60 seconds. Watch for breaking news that might affect your positions.
Customize your workspace
- Adjust news panel by selecting/deselecting items
- Change chart symbols to match your focus
- Switch strategies based on conditions
Switching modes
From pro to lite
- Click the Pro mode toggle in the top-right
- Interface switches to single-panel chat
- Chat history and settings are preserved
From lite to pro
- Click the Lite mode toggle in the top-right
- Interface expands to 4-panel layout
- Chart and news feed load automatically
- Previous expert mode settings restore
Your preference saves in browser storage and persists across sessions. Pro mode will load automatically next time if it was your last selection.
Performance
Loading time
Pro mode loads extra resources:
- TradingView chart library (~350ms delay)
- Market news API data
- Indicator configurations
Give it a few seconds to initialize on first load.
Browser requirements
Works best with:
- Modern browsers (Chrome, Firefox, Safari, Edge)
- Stable internet for real-time data
- Desktop resolution (≥768px width)
Data usage
Pro mode uses more bandwidth:
- Real-time chart streaming
- News updates every 60 seconds
- TradingView interactions
Consider this if you're on limited bandwidth.
Troubleshooting
Chart not loading
Problem: TradingView chart shows blank or loads indefinitely
Solutions:
- Refresh the page
- Check browser console for errors
- Disable extensions that might block TradingView
- Make sure JavaScript is enabled
News feed empty
Problem: News panel shows nothing
Solutions:
- Check your internet connection
- Wait for the 60-second refresh
- Refresh the page to retry
- Check browser console for API errors
Indicators not appearing
Problem: Selected indicators don't show
Solutions:
- Wait a few seconds for the chart to update
- Try deselecting and reselecting
- Clear all and reapply
- Refresh to reset TradingView
Pro mode toggle disabled
Problem: Can't switch to pro mode
Possible causes:
- Screen width below 768px (mobile device)
- Browser window too narrow
Solution:
Use a desktop or expand your browser window. Pro mode is desktop-only.
Next steps
Explore related features:
- Trading commands - All trading operations
- Trading signals - AI-powered signals with technical analysis
- Advanced features - Copy trading and strategies
- Market data commands - Price and market queries
Support
Need help?
- Discord: discord.gg/Fz7aDWkp
- GitHub: github.com/b3x-ai